
TDA - Thread Dump Analyzer
![]()
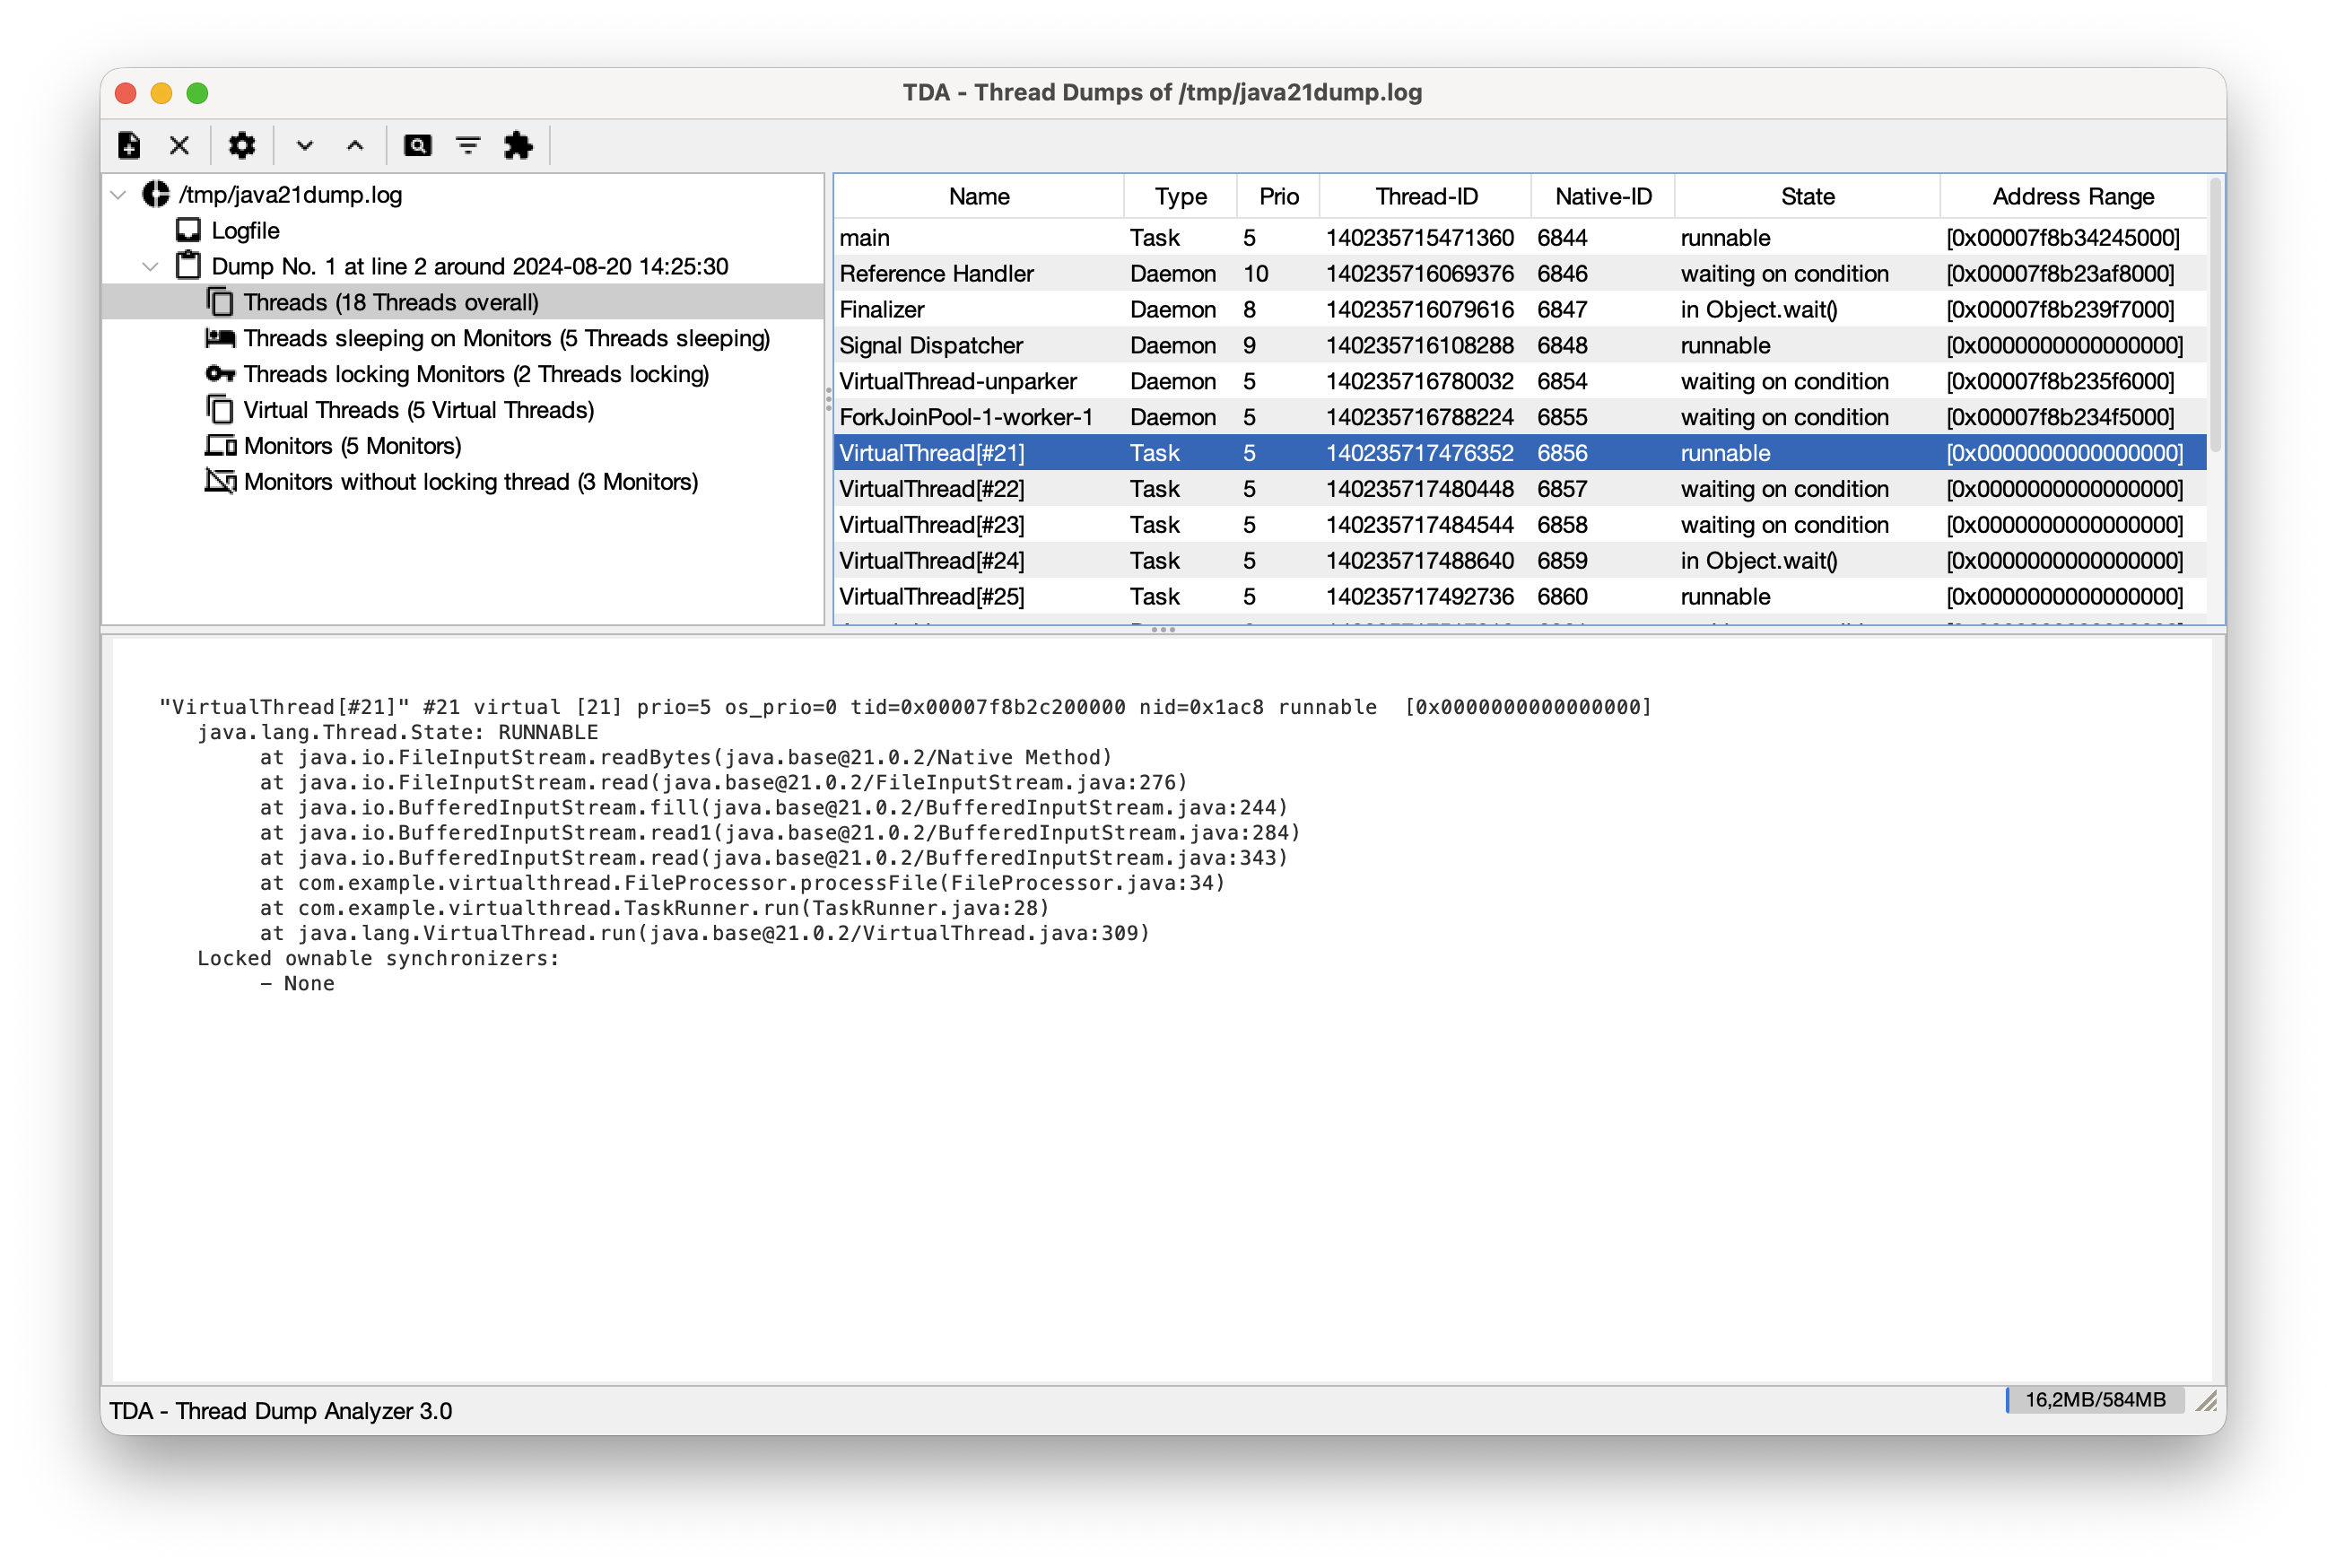
TDA (Thread Dump Analyzer) for Java is a powerful yet lightweight Swing GUI for analyzing Thread Dumps and Heap Information generated by the Java VM. It is designed to assist in diagnosing performance issues, deadlocks, and memory problems in Java applications.
TDA supports Java 1.4.x through Java 21+, including specialized support for Virtual Threads (Java 19+).
🚀 Key Features
- Comprehensive Thread Dump Parsing: Parse multiple thread dumps from log files and display them in an intuitive tree structure.
- Virtual Threads Support: Analyze virtual thread states, pinning issues, and carrier thread relationships.
- Statistical Analysis: Detailed statistics about thread states, monitors, and waiting/locking threads.
- Long-Running Thread Detection: Identify threads that persist across multiple dumps, helping find "hung" or inefficient code.
- Deadlock Detection: Automatic identification of deadlocks with detailed monitor information.
- Class Histogram Analysis: Integrated analysis of heap objects (via
-XX:+PrintClassHistogram). - Flexible Filtering & Categorization: Use custom filters and categories to manage large numbers of threads.
- Session Management: Save and reopen analysis sessions.
🛠 Usage Modes
TDA can be used in four different ways to suit your environment:
1. Standalone Application
The most common way to use TDA for offline analysis of production log files.
How to run:
java -Xmx512m -jar tda.jar
Once opened, you can add log files containing thread dumps. TDA will parse them and display them in the tree view. If you
have several or big log files, you might need to adjust the memory allocation by increasing the -Xmx flag.
Important Features:
- Thread Dump Tree: Navigate through all detected dumps in a log file.
- Regular Expression for Timestamps: Since thread dumps often lack timestamps, you can provide a regex to correlate dumps with log entries.
- Find Long Running Threads: Compare consecutive dumps to see which threads haven't moved.
- Filters & Categories: Group threads by name or state to reduce noise.
- Monitors & Deadlocks: Detailed view of monitor usage and automatic deadlock detection.
2. JConsole Plugin
Analyze a running application directly within JConsole. This is particularly useful for production environments where you need to quickly inspect the state of a live system.
How to use: Start JConsole with the TDA plugin:
jconsole -pluginpath tda.jar
A new "Thread Dumps" tab will appear. From here, you can:
- Request Thread Dumps: Generate fresh dumps directly from the connected JVM.
- Analyze in Real-time: Use all of TDA's parsing and analysis features on the live data.
3. VisualVM Plugin
TDA is also available as a plugin for VisualVM. You can install it directly from the VisualVM Plugin Center. It provides the same powerful analysis tools integrated into your VisualVM workflow.
4. MCP Server (Headless Analysis)
For integration with AI tools (like Cursor, Junie, or Claude Desktop) or automated pipelines, TDA can run as a Model Context Protocol (MCP) server. This allows for headless analysis of thread dumps using AI assistance.
There's also an articel on dev.to about how to use TDA as an MCP server.
How to run:
java -Djava.awt.headless=true -jar tda.jar --mcp
Integration Example (Junie/Cursor):
{
  "mcpServers": {
    "tda": {
      "command": "java",
      "args": ["-Djava.awt.headless=true", "-jar", "path/to/tda.jar", "--mcp"]
    }
  }
}
Available Tools
The MCP server exposes the following tools:
| Tool | Arguments | Description |
|---|---|---|
parse_log | path (string, required) | Parses a log file containing Java thread dumps. This must be the first action for a log file. |
get_summary | None | Returns a summary of all parsed thread dumps (index, name, timestamp, thread/deadlock counts). |
check_deadlocks | None | Checks for and returns information about any deadlocks detected in the parsed thread dumps. |
find_long_running | None | Identifies threads that remain in the same state/stack trace across consecutive dumps. |
clear | None | Resets the server state and clears the internal thread store for a new log file. |
Troubleshooting
- Path issues: Ensure you use absolute paths for the JAR file and the log files you want to parse.
- Headless mode: If you see errors related to
java.awt.HeadlessException, double-check that-Djava.awt.headless=trueis set. - Permissions: Make sure the user running the MCP server has read permissions for the log files.
- Memory issues: If you see
OutOfMemoryErrors, you can increase the memory allocation by setting-Xmx.
🤖 AI Agent Configuration (Cursor / Junie)
To ensure that AI agents use TDA efficiently and don't attempt to read large log files directly (which is slow and expensive), you should configure a System Prompt.
Global Configuration (Recommended):
Instead of project-wise rules, you can configure these instructions globally:
- Cursor: Go to Settings -> General -> Rules for AI and add the recommended system prompt there.
- Junie: Create or edit the file
~/.junie/instructions.mdand add the recommended system prompt.
Project-wise Configuration:
If you prefer project-specific rules:
- Cursor: Add the recommended system prompt to your
.cursorrulesfile in the project root. - Junie: Add the recommended system prompt to your
.junie/instructions.mdfile in the project root.
Recommended System Prompt:
When you encounter a log file that appears to contain Java thread dumps:
1. DO NOT try to read or "cat" the entire file if it's large.
2. Use the `tda-analyzer` MCP toolset.
3. First, call `parse_log(path="...")` to initialize the analysis.
4. Use `get_summary()`, `check_deadlocks()`, and `find_long_running()` to perform the analysis.
5. Provide your insights based on the structured data returned by these tools rather than the raw log text.
This configuration makes the analysis much faster and significantly reduces token usage.
🏗 Building from Source
TDA is built using Maven. It requires Java 11 or higher to build and run.
mvn clean package
This will build all components:
- The standalone TDA JAR (in
tda/target/tda-x.x.jar). - The VisualVM plugins as NBM files (in the
target/directory of eachvisualvm-*module).
The resulting standalone JAR will also be located in the tda/target/ directory.
📋 GCViewer
In combination with TDA for thread dump analysis, you can use GCViewer to visualize heap dumps.
📜 License
TDA is licensed under the Lesser GNU General Public License (LGPL).
For more detailed information, please refer to the source code. The wiki has been removed because it was outdated.